NETZSCH directA Software for Modulated Thermogravimetry
Calculation Methods in directA Versions
NETZSCH directA is the software for analysis of the thermogravimetric data, measured under the conditions of modulated temperature ( modulated thermogravimetry ).
The description of all calculations methods used in both directA versions (Lite and Full) can be found in the following article:
Elena Moukhina. Direct analysis in modulated thermogravimetry, Thermochimica Acta 01/2014; 576:75–83
The Full version of the software contains the all functionality of the Lite version and also additional calculation of the activation energy according to the method from the article:
R. L. Blaine, B. K. Hahn. Obtaining kinetic parameters by mоdulated thermоgravimetry. Journal of Thermal Analysis 54(1998) 695-704.
directA Download Details
Introduction
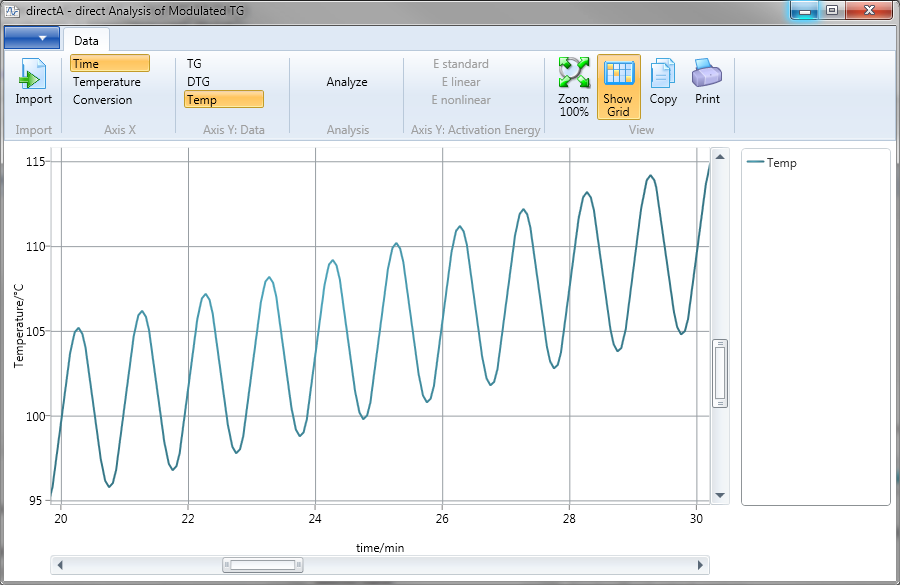
Modulated Thermogravimetry is the analysis method of the thermograviometric data measured under conditions of the modulated themperature. Modulated temperature is the sum of the underlying linear heating or constant temperature and sinus-shaped temperature oscillations with user-defined amplitude and period.
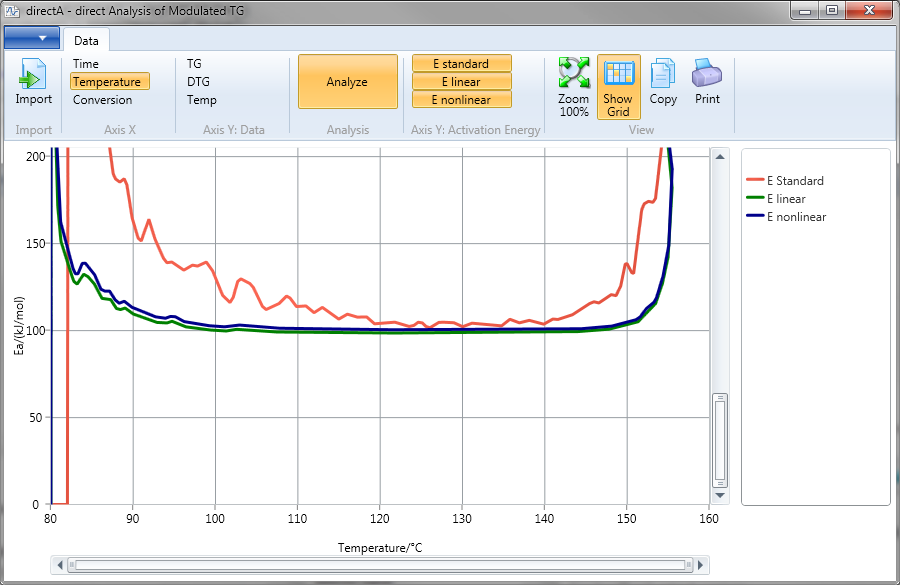
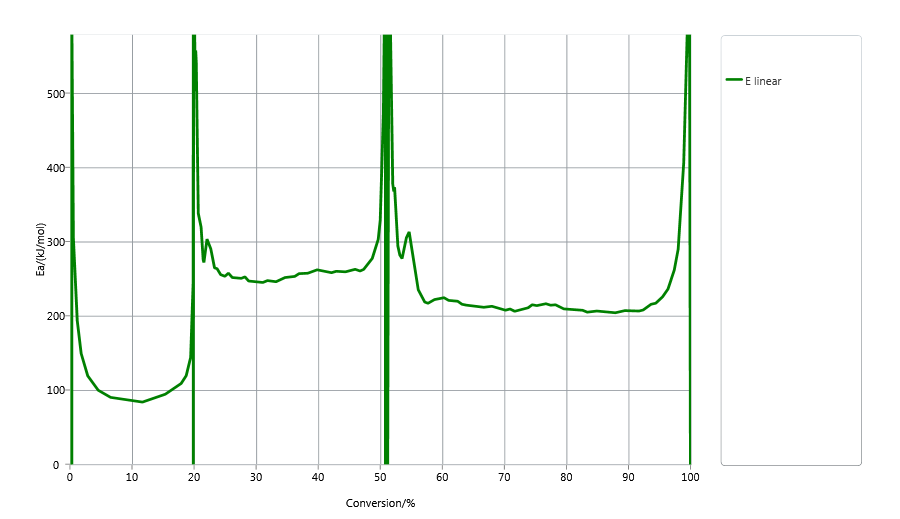
The directA software calculates activation energy of chemical reactions from one thermogravimetric measurement. The activation energy is shown as the continuous function of time, temperature or reaction conversion over the whole measurement.
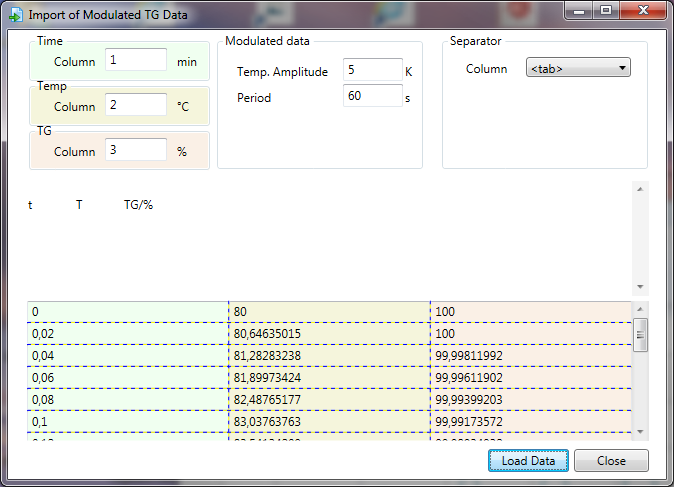
Data Import
The software can import data in plain text ASCII format. These data files can be created by export from the software connected with your instrument. Another way is tab-delimited ASCII export from Microsoft® Excel. Data for analysis must be time-equidistant.
During data import user must point here the column number for time, temperature and modulated Thermogravimetric signal. Additional required information is the temperature amplitude and oscillation period.
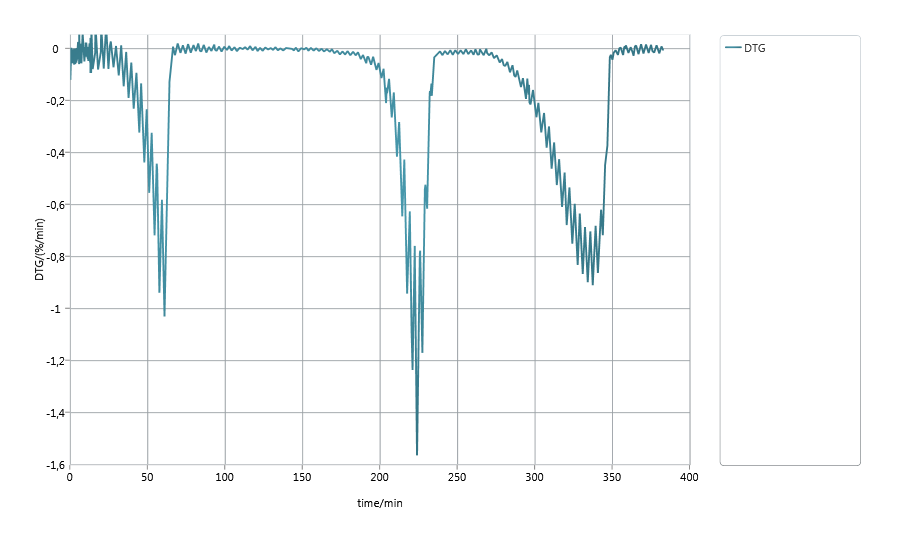
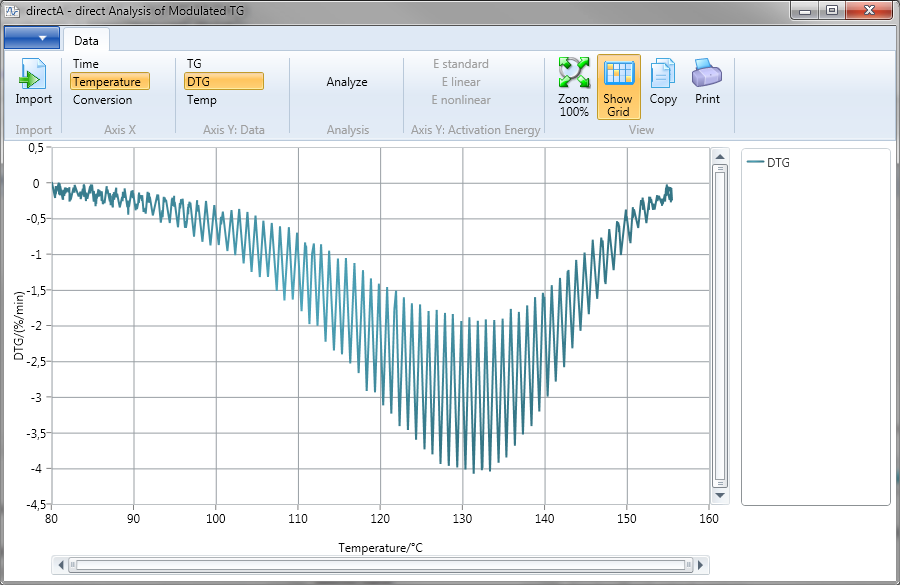
Imported data can be shown as the one of signal type: TG, DTG or modulated temperature. X-Axis is time, temperature or reaction conversion.
Analysis
Analysis of the calculatied data is done by three different methods: Standard method, Linear Method and Non-linear Method. Details about all three calculation schemes can be found in the article: Elena Moukhina. Direct analysis in modulated thermogravimetry, Thermochimica Acta 01/2014; 576:75–83.
The software has the functionality of graphic zoom, copy graphic to clipboard and print graphic.